I have recently attempted to use MATLAB to plot grouped bar plots (similar to the BAR(Y,’grouped’) call) together with their error bars. It’s not straightforward. There are a few user-made custom function on the File Exchange that tackle this issue, but I wasn’t all that happy with the graphic results. So I’ve made my own wrapper function that successively calls BAR, then ERRORBAR, taking care to overlay the error bars right on top of the corresponding bars. I think that the function could be useful to others, so I’ve uploaded it to the File Exchange: ERRORBAR_GROUPS produces customizable grouped bar plots with overlaid error bars.
At its most basic, this function produces bar plots similar to those obtained using MATLAB’s BAR(Y,’grouped’) function call, and then overlays error bars onto the corresponding bars.
ERRORBAR_GROUPS allows customizing the plot in several ways. For instance, both the width of the bars themselves and that of the error bars can be adjusted. The function allows asymmetric values for the lower and upper bounds of the error bars. The colors of the bars and error bars can also be customized. By default, ERRORBAR_GROUPS uses the function DISTINGUISHABLE_COLORS by Timothy E. Holy (which is a great feature, by the way!).
ERRORBAR_GROUPS allows transmitting optional input property-value pairs to both the BAR and ERRORBAR functions, making it quite versatile.
Here are some examples of what ERRORBAR_GROUPS can do.
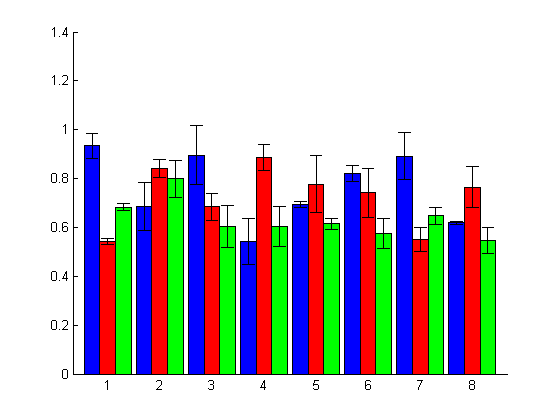
Basic usage. Plot 3 groups with 8 bars each and their corresponding error bars.
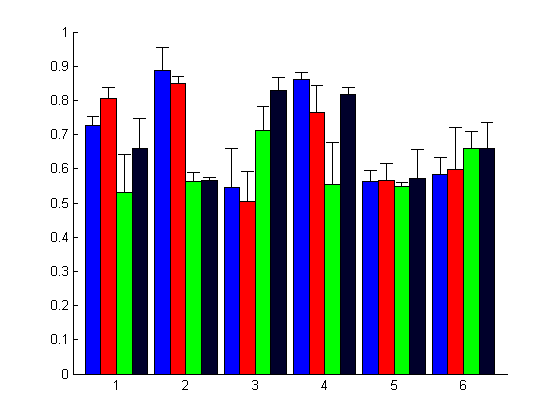
The upper and lower bounds of the error bars need not be the same. Here is an example with the lower bounds set to be 0, effectively plotting only the upper bounds.
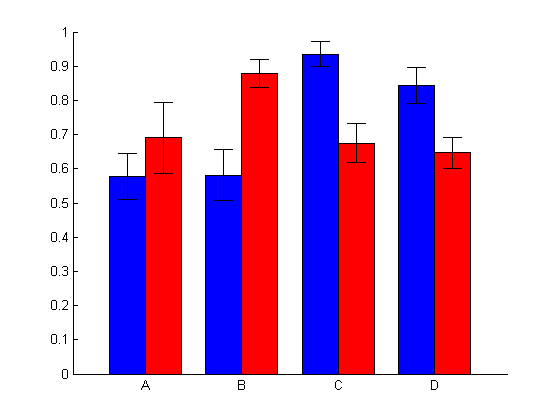
When plotting smaller numbers of groups and bars, it might be visually more appealing to reduce the width of the bars and of the error bars.
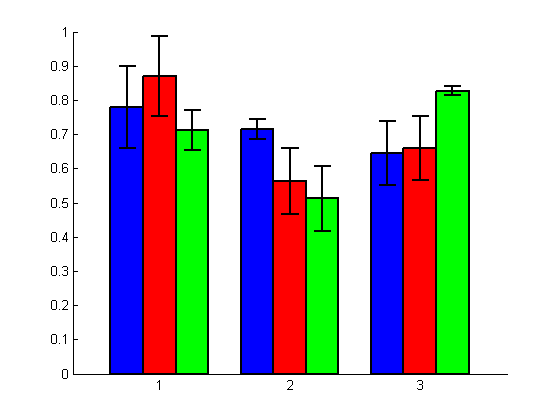
The function can pass PropertyName – PropertyValue pairs of input arguments to both the BAR and ERRORBAR functions, which allows for considerable customization!


Great Work Pierre! Je te propose humblement de modifier la dernière ligne comme suivant:
set(gca,’XTick’,bar_xtick,’XTickLabel’,bar_names,’FontSize’,16); xlim([0 size(bar_input,1)*size(bar_input,2)+1])
pour distribuer les bars de manière égale sur le x.
LikeLike
Merci Markus! You’re right, this was an oversight on my part. I’ve added the following line at the end:
set(gca,'XLim',[0 bar_xtick(end)+bar_xtick(1)]); % adjusts the x axis to the plotThanks again for your helpful comment!
LikeLike
[…] Grouped bar plots with error bars […]
LikeLike
Thanks for the program. In R2015a, the bar’s x-positions for the last group are wrong. I traced the problem to errbar_groups.m, lines 247-265:
for grp=1:N_grps
if verLessThan(‘matlab’, ‘8.4.0’).
…
If these are commented out, the program seems to work fine.
LikeLike
Thank you for your comment. Matlab R2014b brought some significant changes to the way graphical objects are handled, with the consequence that my function doesn’t work too well with versions R2014b and beyond. And since I am stuck with R2009b for now, I can’t debug it properly. I’m sorry for the inconvenience and hope that you still found the function helpful.
LikeLike
Hello,
I keep getting the errors below anytime I run your files:
Undefined function or variable ‘makecform’.
Error in distinguishable_colors (line 93)
C = makecform(‘srgb2lab’);
Error in errorbar_groups (line 125)
bar_colors=distinguishable_colors(N_grps); % get some distinguishable colors for the bars!
Kindly help
LikeLike
Hi Joseph, the error comes from the
distinguishable_colorsfunction, which calls themakecformfunction, which itself is part of MATLAB’s Image Processing Toolbox. It looks like you do not have that toolbox installed. In order to get around the issue, you should comment out line 125 in the function’s code. You can control bar color by providingerrorbar_groupswith the optional'bar_colors'input. Let me know if that helps.LikeLike